Oh, Hell: 1 Card Probabilities
27 Feb 2023In this post, I will show you how to defeat your family members at cards using R data visualizations. This is a bit of a sloppy post to try to just get the work out there rather than have it be perfect :).
Oh, Hell
Oh, Hell is a trick-taking card game which goes by many names. For the particularly language-sensitive it is also known by “Oh, Heck,” and according to Wikipedia even has the delightful alternate name “Oh, Pshaw!” Oh, Heck is one of my family’s favorite games for a few reasons.
-
The number of players is flexible. Everyone wants to play? Great. Grandpa wants to go to bed early? Okay. Chris is making data visualizations about “Oh, Heck” instead of actually play? Well, uh, alright.
-
It require the right level of thinking, somewhere between totally mindless and chess-level mental effort.
-
The rules and strategy are very clear (a big plus for certain members of my extended family who will remain nameless). This isn’t an “Apples to Apples” that relies on guessing one person’s sense of humor.
The rules work as follows:
- Bidding
- In each round, cards are dealt out.
- Players look at their hands and guess how many tricks they will take.
- All the players simultaneously “bid” that number, by putting your fingers out at the same time.
- Gameplay
- Play commences, with the dealer going first.
- Players must follow suit. The highest card in a suit wins, but…
- Spades are always trump: if you don’t have the suit led, you can play a spade, and then the highest spade wins the trick.
- Scoring
- If you make your bid, you get your bid in points, plus ten additional points.
- If you go over your bid, you get the number of tricks you took.
- If you go under your bid, you get 0 points.
- (Example: I bid 3. If I take 4 tricks, I get 4 points; If I take 3 tricks, I get 13 points, if I take 2 tricks, I get 0 points.)
- Rounds
- After the round is over, start the next round, with new cards, new deal, etc.
- Each round, the number of cards dealt to each player decreases by 1, where in the last round, everyone gets only one card.
The One Card Problem
At this point in the post, I admit that the first sentence was engagement-bait and that I will only show you how to play the last round of “Oh, Hell” optimally. Many times, the game may come down to the last round. This is fun (and frustrating) because there is essentially no gameplay in the last round: you just bid 1 or 0 and hope your card beats everyone else’s card (or hope it doesn’t). My heuristic has always been: if I have a spade, bid 1, and if I don’t bid 0. After doing some rough estimates in my head I realized that this might be wrong, and I decided to actually calculate your odds of winning in the last round with any given card. I’ll explain the math in a little more detail, show my visualization of your odds of winning, show off some pictures of my viz printed out, and finally conclude with the R code.
The Math
What are your odds of winning in the last hand of “Oh, Hell?” It depends on what your card is, of course, and also if you are leading. In terms of your card, the important characteristics are how “high” the value of your card is (we play 2 is lowest, ace is highest) and whether or not it’s a spade. For all other suits, the situation is symmetric so it doesn’t matter what they are.
Leading
Suppose you have the 5 of diamonds, you are leading, and you’re playing against 3 other people. What is the probability that your card will take the trick? It is precisely the probability that no one has either a spade or a diamond that is higher. Some keys facts:
- The probability that you will win the trick is the probability that everyone has a card that loses to yours.
- Since you have a card, there are 51 cards remaining (a standard deck has 52 cards).
- The number of spades is 13: they all beat you.
- The number of higher diamonds is 9: they all beat you.
- Therefore there are 22 cards out that can beat you.
- Likewise, there are 29 cards that lose to yours (= 52 - 1 - 22).
The probability that three players all have cards that lose to yours is then:
\[p = \frac{29}{51} * \frac{28}{50} * \frac{27}{49}\]Now let’s make it more abstract. If there are $n$ players, and there are $c$ cards that lose to yours, the probability of winning is then:
\[\prod_{i=0}^{n-1} \frac{c - i}{51 - i}\]Following
If you are not leading, we need to handle two cases: having a spade or not having a spade.
Case 1: If you have a spade, the probability of winning is just the same as above. Whoever has the highest spade wins.
Case 2: The calculation diverges if you don’t have a spade. Because you have to “follow suit,” you can only win a trick if your card is the same suit as the lead (or a spade). So we need to add into the calculation the probability that the first card led is a card in your suit, that is worse than your card. We introduce another variable, $s$, the number of cards that lose to yours in your suit.
\[\frac{s}{51} \prod_{i=1}^{n-1} \frac{c - i}{51 - i}\]Pretty graphs
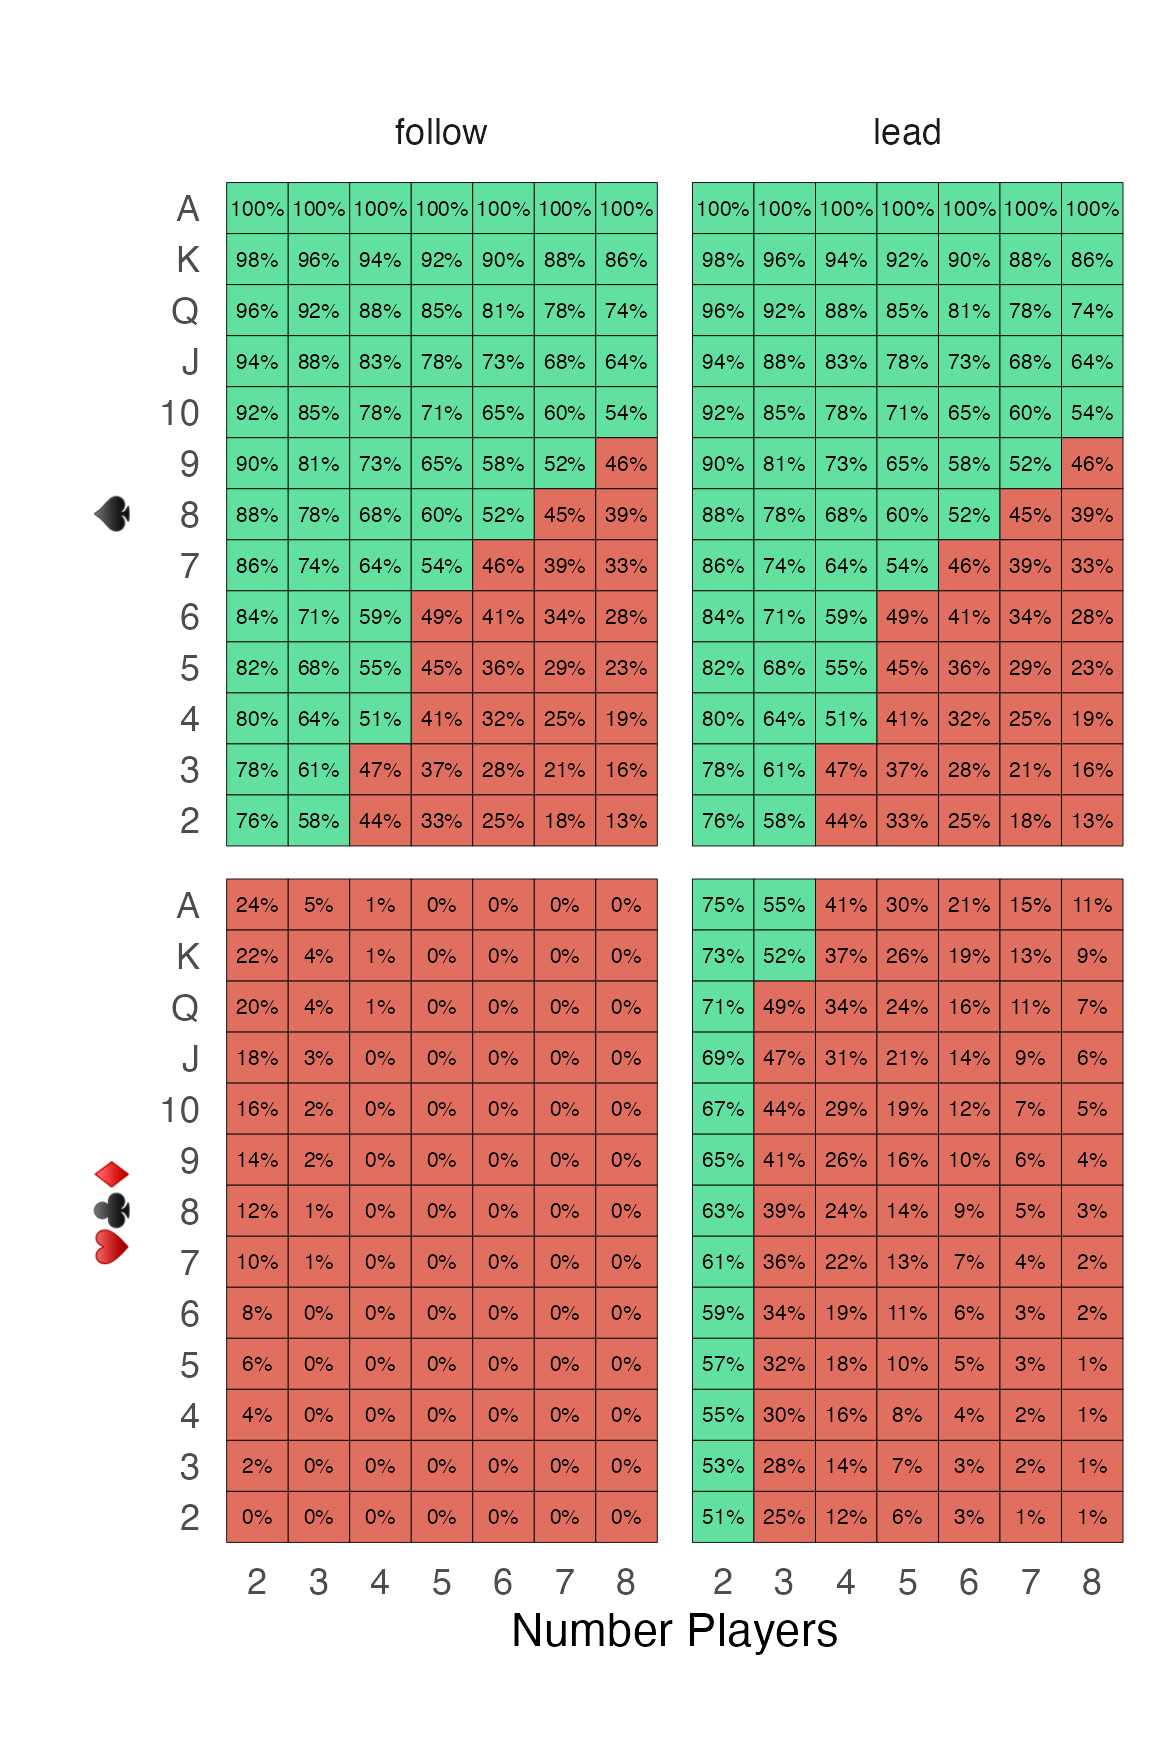
In my style of how to present a graph, we have…
- The $x$ axis is the number of players.
- The $y$ axis is the value of your card.
- The number in each cell is your chance of winning the trick.
- The color of each cell says if you should bid 0 (red) or 1 (green).
- The left columns show how you should bid when you are following.
- The rights columns show how you should bid when you are leading.
- The upper row applies when you have a spade.
- The lower row applies when you have a card that isn’t a spade.
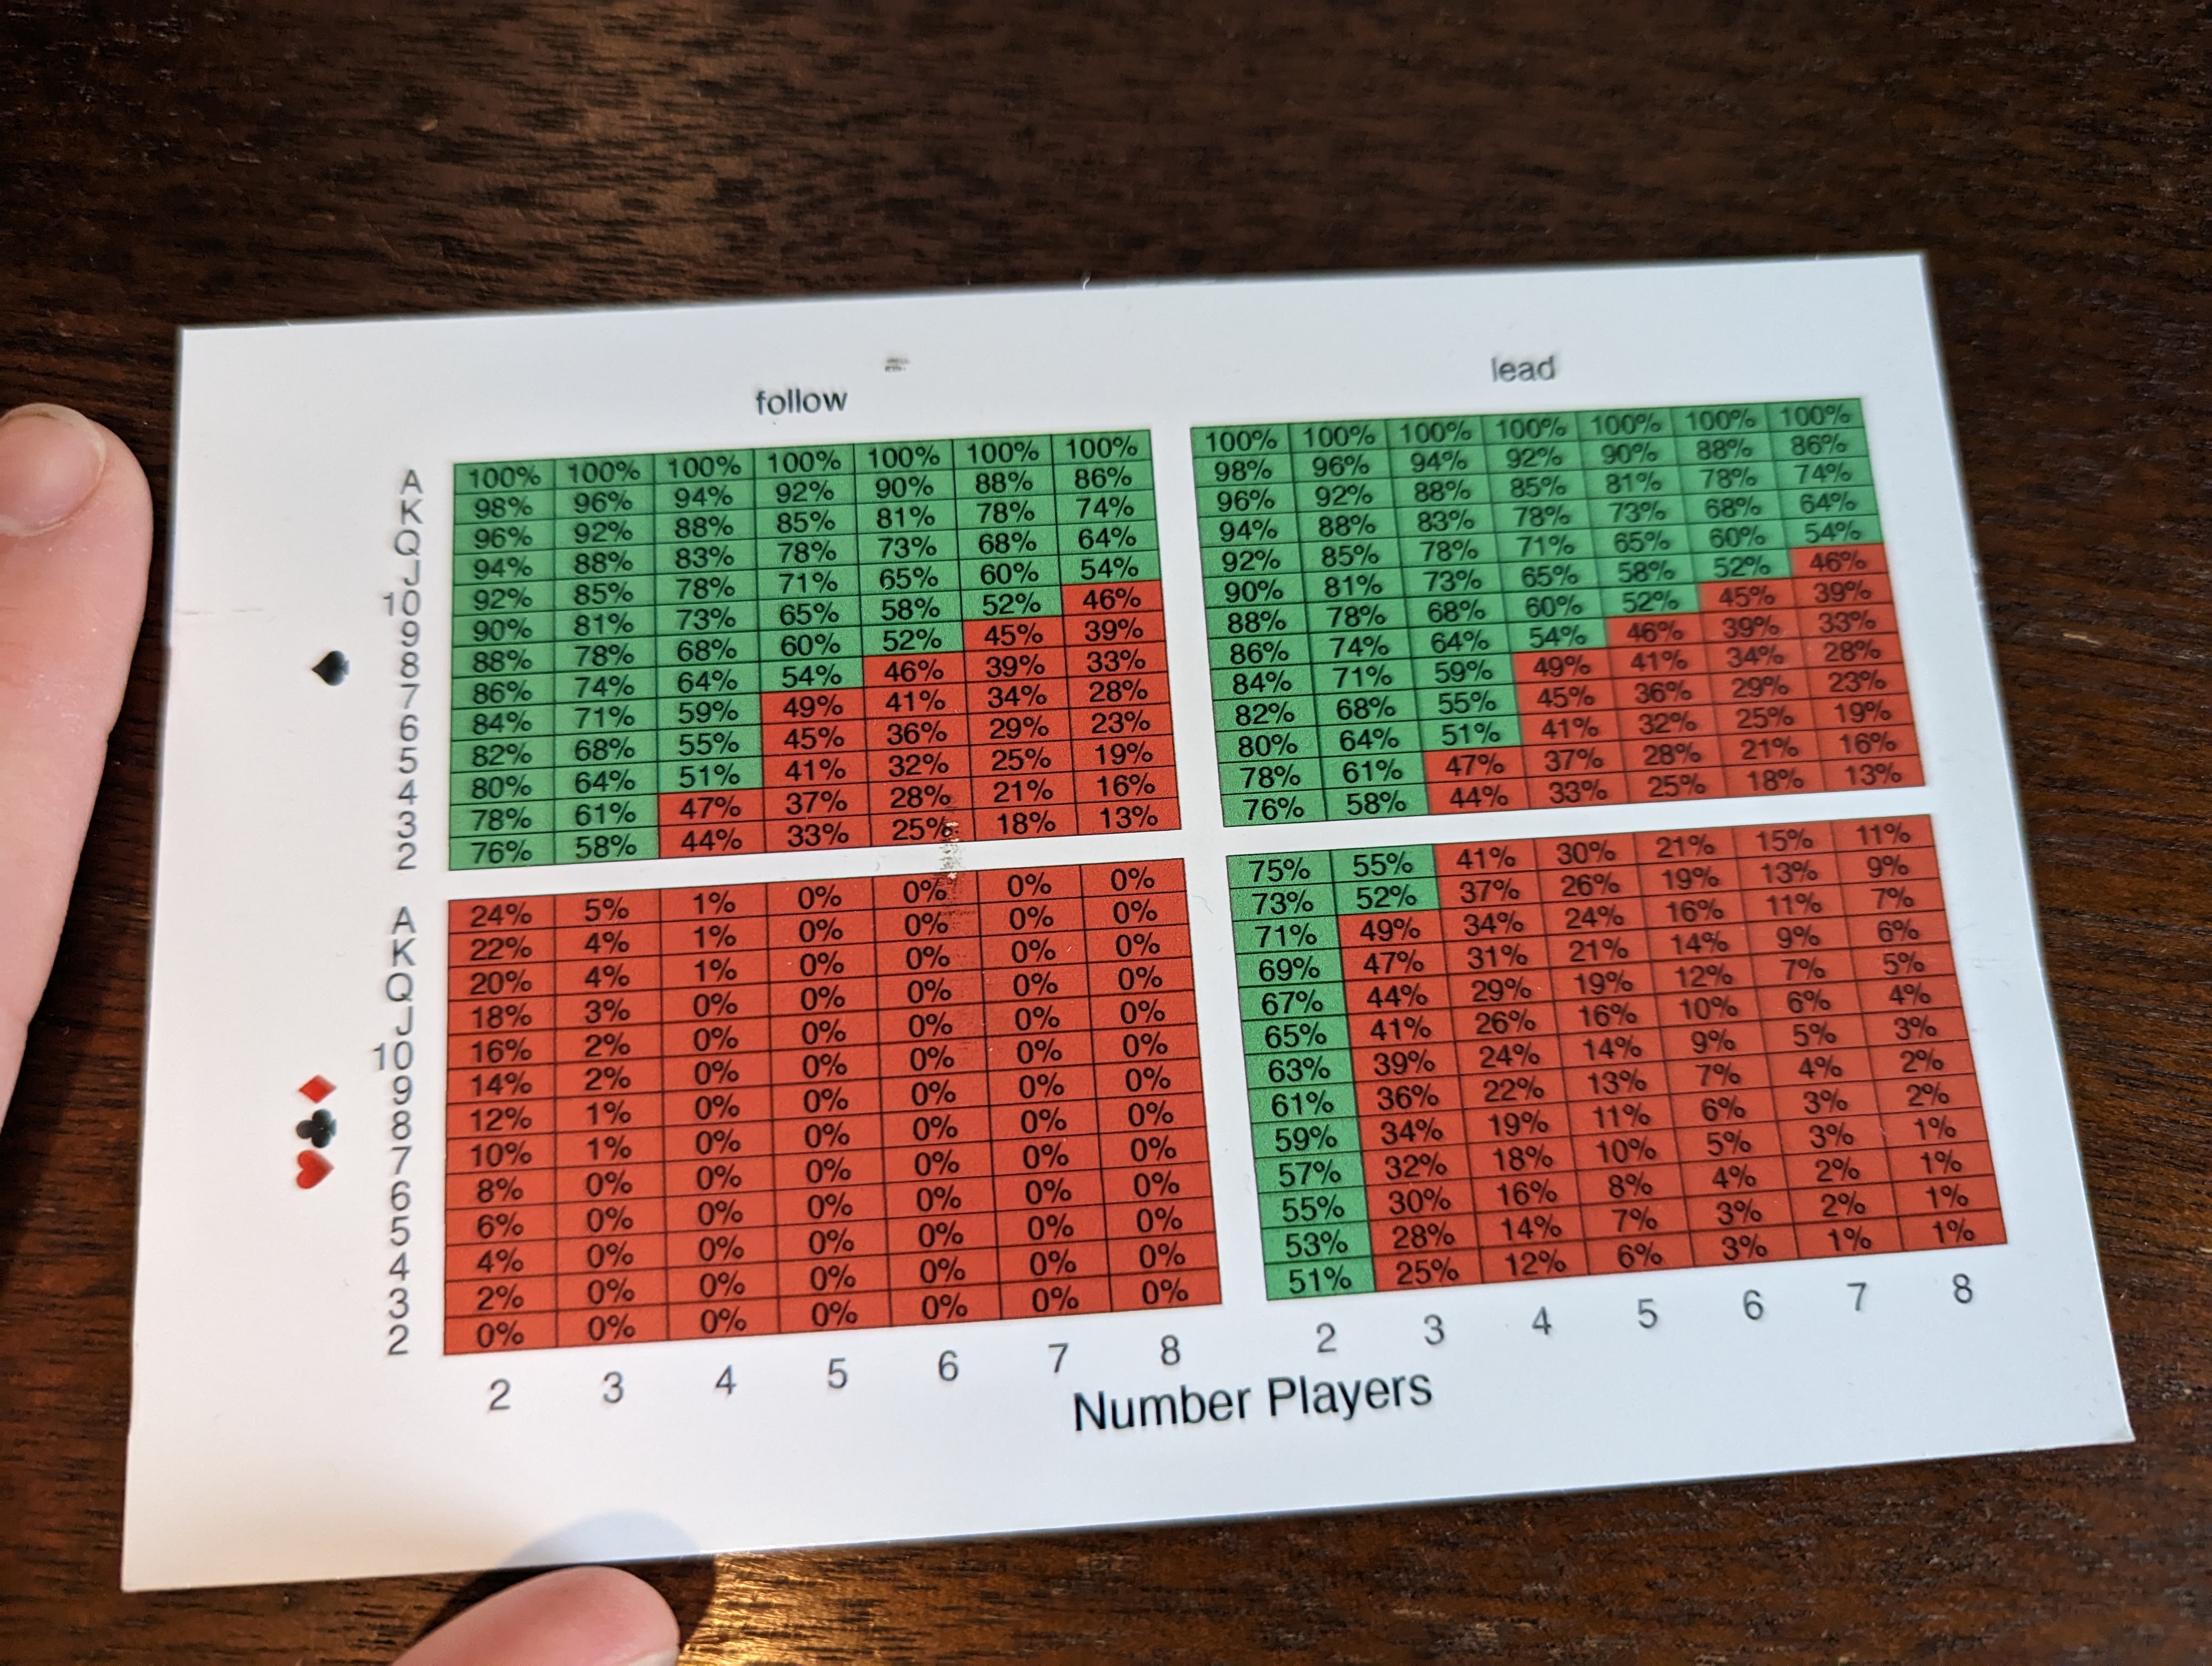
Physical prints!
Through the miracle of the internet and particularly the ggirl package, it was extremely easy to get a print of these. In face, all I had to do was install a new R package and I could have the graph shipped as a postcard to wherever I wanted in the world.

Code
All code is available here on Github.
For completeness, here it is below as well:
# Chris Riederer
# 2022-09-02

# Make a graph showing what to do in your last move of the Oh Hell card game.

library(gt)
library(tidyverse)


################################################################################
## Set up data.


# Create initial data frame of card suits and values.
suits <- tibble(suit = c('HCD', 'S'))
# suits <- tibble(suit = c('♥️♣️♦️', '♠️'))
values <- tibble(value = 2:14)
# card_values <- fct_relevel(c(2,3,4,5,6,7,8,9,10,'J', 'Q','K', 'A'),
#                            levels = c(2,3,4,5,6,7,8,9,10,'J', 'Q','K', 'A'))
# values <- tibble(value = values)
df <- crossing(suits, values) %>% arrange(suit, value)
df <- df %>% mutate(is_spade = suit == 'S')
df %>% head
df <- df %>% mutate(card_value = ifelse(
  value == 11, 'J',
  ifelse(value == 12, 'Q',
         ifelse(value == 13, 'K',
                ifelse(value == 14, 'A',
                       value))))
)
df <- df %>% mutate(card_value = fct_relevel(card_value, levels = c(2,3,4,5,6,7,8,9,10,'J', 'Q','K', 'A')))
df %>% head(14)


# Add column showing number of cards better if you're leading or following.
df <- df %>%
  mutate(
    num_cards_better =
      if_else(
        suit == 'S',
        15 - value - 1,  # If spade, only beaten by other spades.
        # If leading and not a spade, beaten by all spades and higher cards in your suit.
        13 + 15 - value - 1,
      )
  )

# Make new rows for different numbers of players.
num_players_tibble <- tibble(num_players = c(2:8))
df <- crossing(df, num_players_tibble)

# Make new rows for if you're leading or following.
lead_tibble <- tibble(is_lead = as.factor(c("lead", "follow")))
df <- crossing(df, lead_tibble)

# Arrange it to make it looks nice.
df <- df %>% arrange(is_lead, num_players, suit, -value)

# Take a peek.
View(df)


################################################################################
## Compute probability of winning.

prob_no_card_better <- function(num_cards_worse, num_available_cards, players) {
  if(players == 0) { return(1)}
  return(
    (num_cards_worse / num_available_cards)
    * prob_no_card_better(num_cards_worse - 1, num_available_cards - 1, players - 1)
  )
}

win_probability_lead <- function(num_cards_better, num_players) {
  prob_no_card_better(
    52 - num_cards_better - 1,
    51,
    num_players - 1)
}

win_probability_follow <- function(num_cards_better, num_players, is_spade, value) {
  if (is_spade) {
    return(win_probability_lead(num_cards_better, num_players))
  }

  num_cards_worse_suit <- value - 2
  prob_worse_card_in_suit_lead <- num_cards_worse_suit / 51

  prob_no_other_card_beats_yours <- prob_no_card_better(
    num_cards_worse_suit - 1, # -1 because one was already played, the lead.
    52 - 2, # All cards -1 for your card -1 for the lead
    num_players - 2
  )
  return(prob_worse_card_in_suit_lead * prob_no_other_card_beats_yours)
}


win_probability <- function(num_cards_better, num_players, is_lead, is_spade, value) {
  if(is_lead == "lead" || is_spade) {
    return(win_probability_lead(num_cards_better, num_players))
  }

  # Only handling non-spade follow
  return(win_probability_follow(num_cards_better, num_players, is_spade, value))
}


df <- df %>%
  rowwise %>%
  mutate(win_prob = win_probability(num_cards_better, num_players, is_lead, is_spade, value)) %>% #, suit, value)) %>%
  ungroup()
View(df)


################################################################################
## Graph it.

final_plot <- df %>%
  mutate(suit = ifelse(suit == 'S', '♠️', '♥️♣️♦️')) %>%
  # mutate(card_value = fct_relevel(card_value, levels = c(2,3,4,5,6,7,8,9,10,'J', 'Q','🤴', 'A'))) %>%
  mutate(card_name = paste0(suit, str_pad(value, 2))) %>%
  mutate(binary_win = win_prob > 0.5) %>%
  ggplot(aes(x = as.factor(num_players), y = as.factor(card_value), fill = binary_win)) +
  geom_tile(color = 'black') +
  geom_text(aes(label = scales::label_percent()(win_prob)), size = 1.8) +
  # facet_grid(rows = vars(suit), scales = "free_y") +
  facet_grid(suit ~ is_lead, scales = "free_y", switch = "y") +
  scale_fill_manual(values = c('#E06F60', '#61E0A0')) +
  xlab("Number Players") +
  ylab("") +
  theme_minimal() +
  # theme_bw() +
  theme(
    legend.position="none",
    strip.placement = "outside", # Move suits to left of card values on y axis
    panel.grid.major = element_blank(),
    panel.grid.minor = element_blank(),
    aspect.ratio = 5.84 / 3.84
  ) +
  NULL
final_plot
ggsave("ohheck_postcard.png", width = 3.84, height = 5.84, units = "in")


###############################################################################
## Send postcard

library(ggirl)
contact_email <- "blair.waldorf@example.com"

send_address_1 <- address(name = "YOUR NAME HERE",
                          address_line_1 = "1136 Fifth Avenue",
                          city = "New York",
                          state = "New York",
                          postal_code = "10128",
                          country = "US")

message_1 <- "Now you know how to bid in Oh, Heck!"


ggpostcard_preview(final_plot)


ggpostcard(final_plot,
           contact_email,
           messages = message_1,
           send_addresses = send_address_1)